Kickstarter Projects Success Prediction (ML)
Kickstarter is a popular crowdfunding platform that has enabled many individuals and organizations to bring their creative projects to life. Understanding the success factors of Kickstarter projects is crucial for both creators and investors, as it can help them make better decisions and increase their chances of success. Our study takes a step towards achieving this goal by exploring the effectiveness of different models in predicting the outcome of Kickstarter projects. Through this analysis, we aim to provide a comprehensive evaluation of the models and predictors that are most effective in predicting the success of Kickstarter projects.
Dataset
Our dataset, sourced from WebRobots.io, comprises information on 25,614 Kickstarter projects spanning from 2009 to 2022. The data encompasses a diverse range of business sectors, including Software, Graphic Novels, Pop, Fiction, Comedy, Product Design, Plays, Graphic Design, Events, and Webcomics.
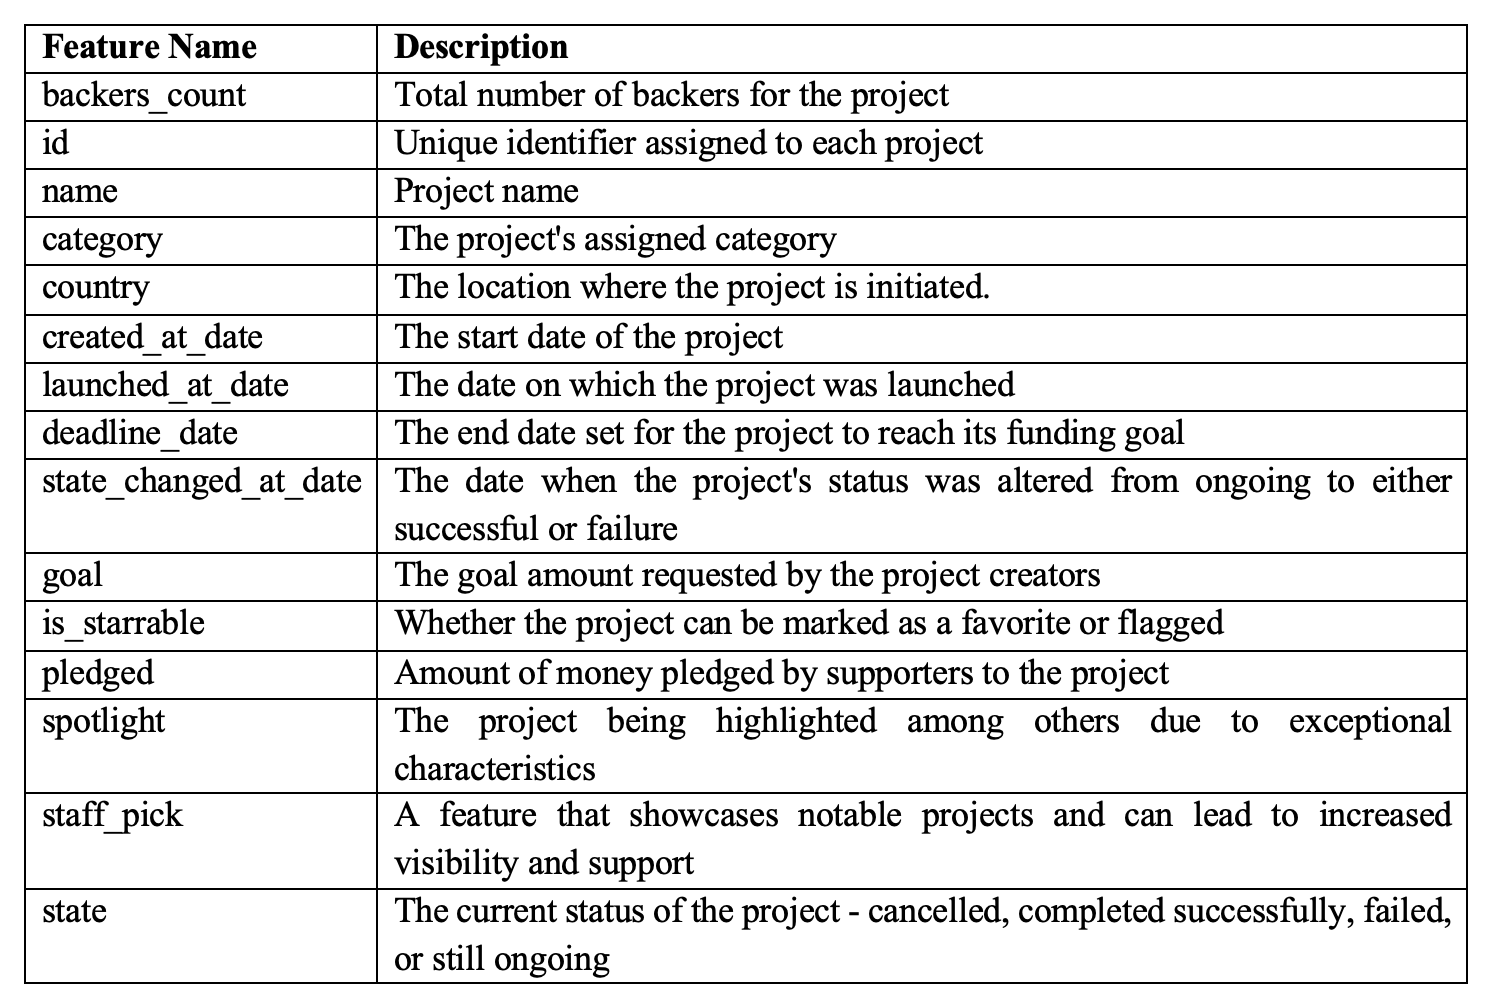
The dataset includes 40 columns, which consist of:
Data Preparation
We began our analysis by examining the dataset for duplicates, which were subsequently removed. In terms of entropy, we eliminated features that were unique and inseparable, as these could complicate computations and potentially hinder predictions.
To make the dataset more suitable for modeling, we manipulated features such as day_duration, week_duration, Year, Month, and Project_category. Using the Start and End dates, we calculated the total time taken to complete projects (day_duration and week_duration) by finding the difference between epoch values. Furthermore, we extracted the project’s category from the original multi-feature category data and created a new field called “Project_category”.
The dataset was sufficiently complete, with no missing or null values, allowing us to proceed with our analysis without further modifications.
For data analysis, we used histograms to visualize feature distributions and boxplots to detect outliers. Outliers were identified in features such as pledged, goal, and backer_count. To retain potentially useful data, we addressed these outliers by defining acceptable boundary limits instead of deleting them.
Exploratory Data Analysis
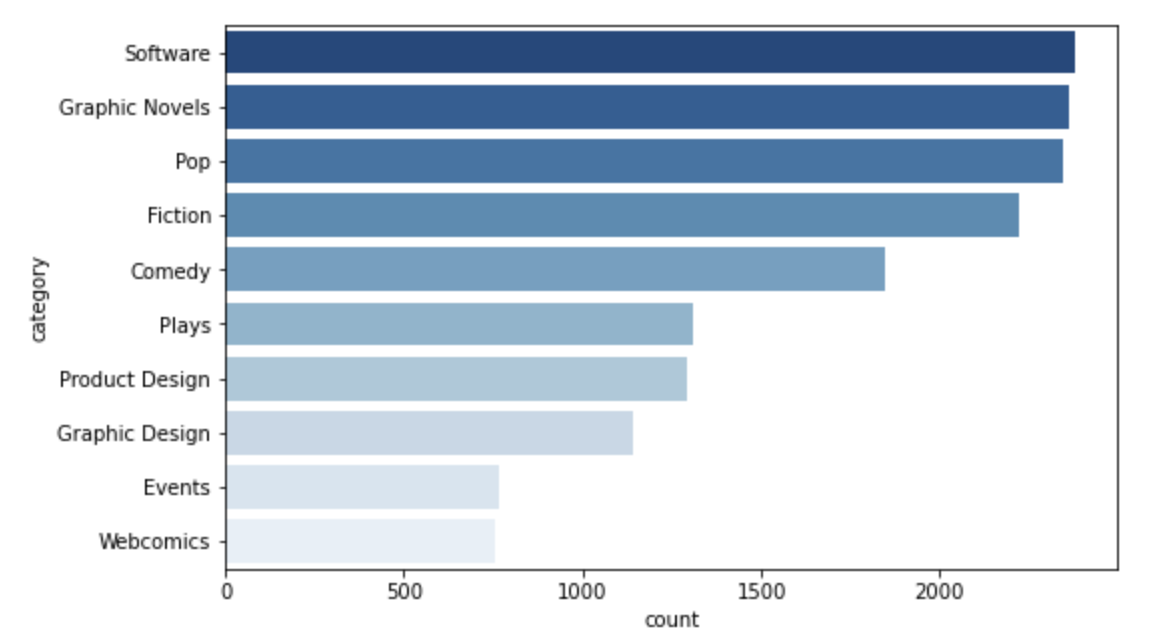
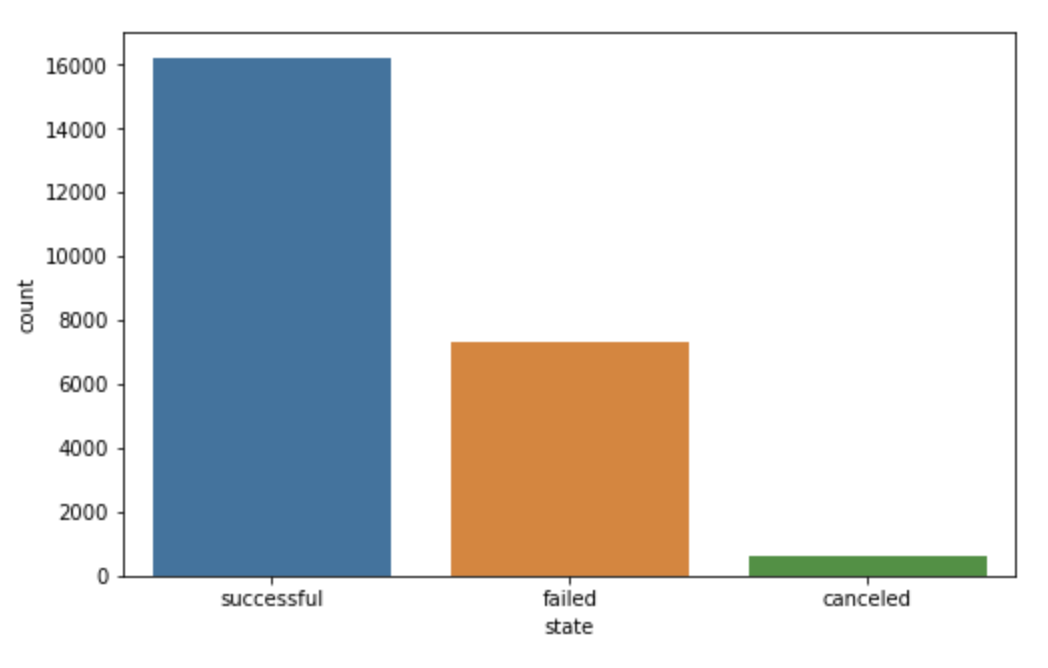
As part of our exploratory data analysis, we investigated the distribution of the target variable and identified that the “Successful” and “Failed” categories were the most common, while “Canceled” and “Live” had a lower frequency. We also examined the most prominent project categories and observed that “Software” and “Comedy” were the most prevalent, with most projects originating from the US and the UK.
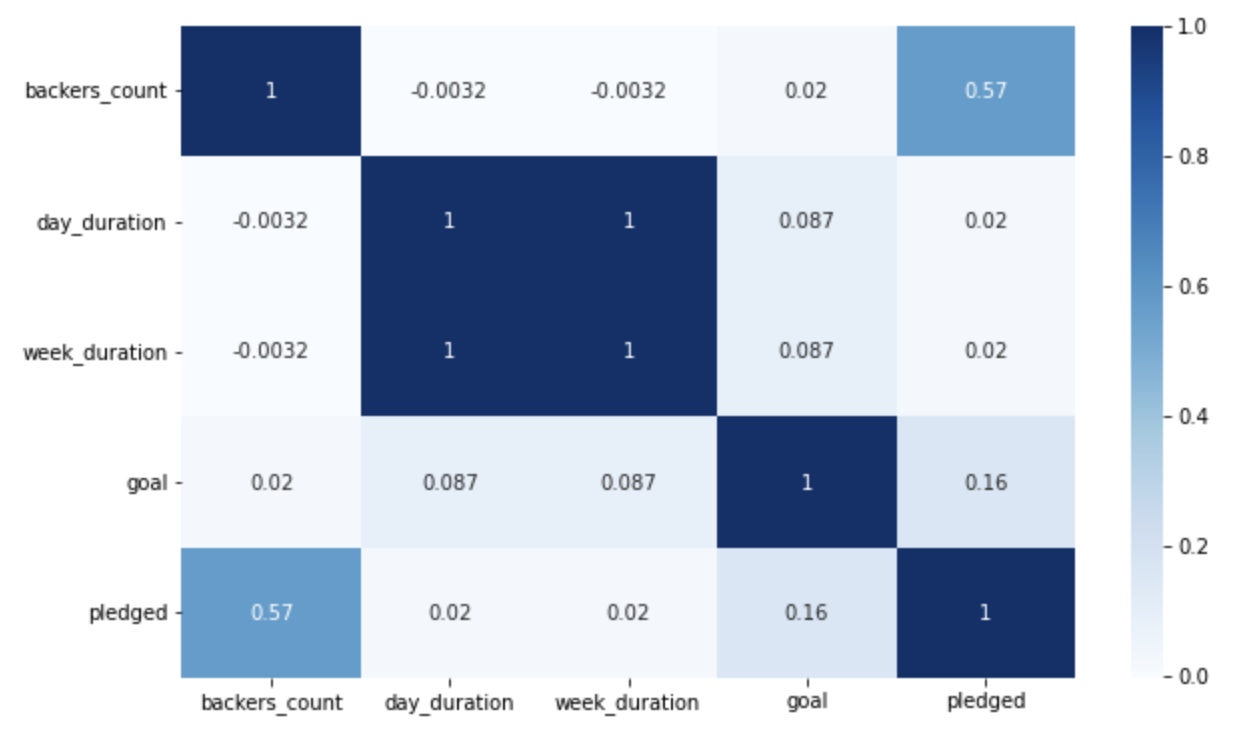
The correlation matrix aided in identifying the strength of relationships between features, enabling informed decisions on feature inclusion in our analysis. This understanding ensures our model makes predictions based on relevant and meaningful data.
Decision Tree Model
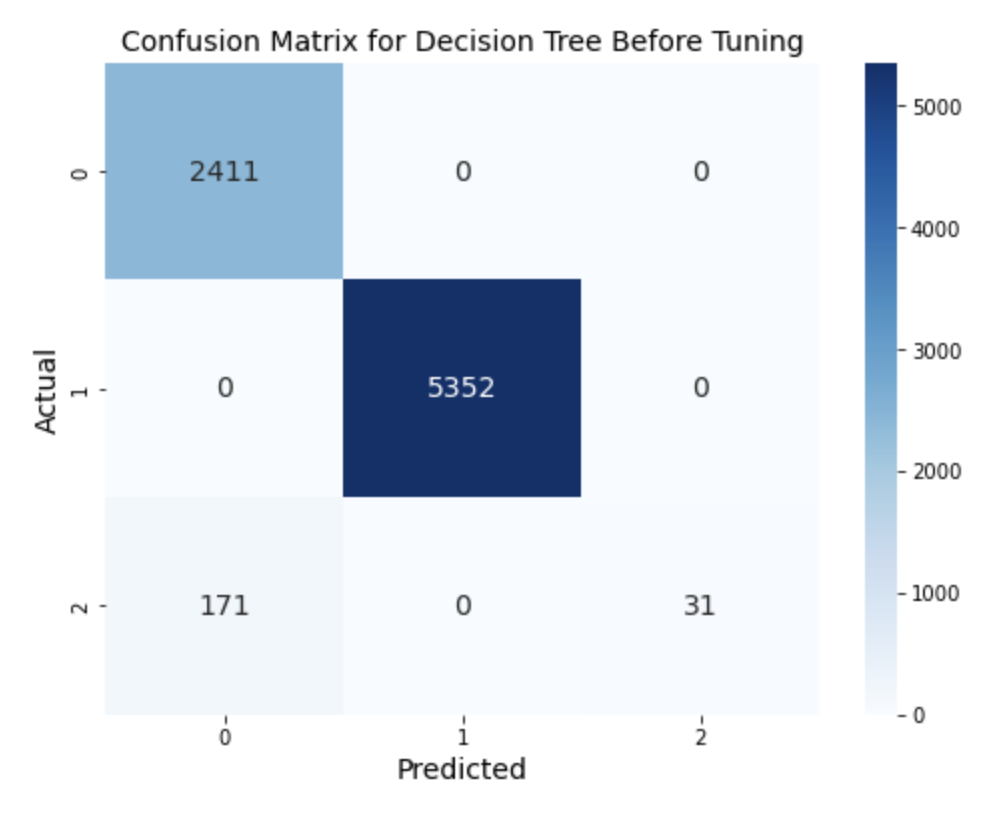
In our analysis, we employed a decision tree model with the Gini criterion and an initial depth level of three to investigate the impact of the “Web” category feature on project failure prediction. The results revealed that the “Web” category had a high prediction score of 98% for failure. However, the accuracy of the “canceled” category was low, and increasing the depth level risked overfitting. To address this issue, we utilized hyperparameter tuning with GridSearchCV, resulting in a maximum depth of 10, minimum samples per leaf of 1, and minimum samples per split of 5. Although the accuracy of the model improved, it still failed to identify the relationship between the “canceled” category and other categories. We considered sacrificing Recall for the “canceled” category but found that doing so would significantly impact the overall accuracy or F1 score, as indicated by the ROC and PR curves.
Random Forest Model
We conducted a second analysis using Random Forest Classification to compare its performance with the Decision Tree model and identify the best-performing model. We began by analyzing the significance of features and selecting the top four features to use in the model, as shown in Figure 9.
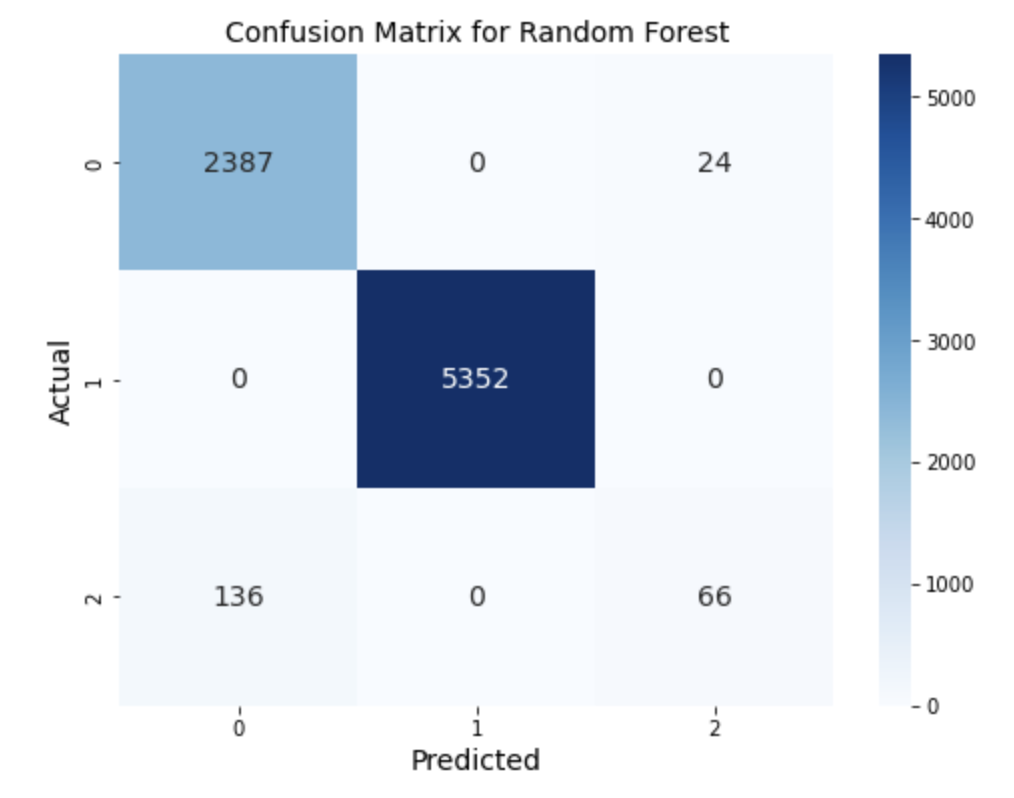
The Random Forest model produced a slight increase in accuracy by 1 percent, but the recall for the “canceled” category was almost 44%, which is a critical point to highlight.
We compared the original and optimized Random Forest matrices, as shown in Figure 10, and found that shifting the confusion matrix to prioritize the “canceled” category would not result in a significant increase in precision and recall. In fact, it would lead to a much greater decrease in overall accuracy. Therefore, we opted to use the most optimal parameters for the Random Forest model.
Overall, our analysis showed that Random Forest outperformed Decision Tree in terms of accuracy and recall for the “canceled” category. These findings provide valuable insights into the effectiveness of machine learning models in predicting the outcomes of Kickstarter projects.
Other Models
We also tested other machine learning models, including XGBoost, CatBoost and Gradient Boosting Machine (GBM), but found that their performance was not as good as Random Forest. We also explored using multiclass regression models, such as logistic regression, and applied L1 and L2 regularization to address multicollinearity issues. However, these models did not perform as well as Random Forest, especially in predicting the “canceled” class. Additionally, the models’ ability to predict success and failure was also not as accurate.
Conclusion and Recommendation
In conclusion, our thorough analysis recommends using the Random Forest model as the best choice for predicting project outcomes, as it achieves high accuracy across all categories, including the crucial “canceled” category. However, if stakeholders decide to disregard the “canceled” category, the CatBoost model emerges as the top choice due to its superior performance in predicting the two main categories (True and False).
Companies seeking to forecast project success or failure can rely on our chosen models with an expected accuracy of around 98%-99%, providing valuable insights for decision-making. It is important to note that the “canceled” category might require separate consideration, as most models group it with the “failed” category, potentially affecting the model’s accuracy.
As the business environment evolves, the model may require periodic fine-tuning to maintain its predictive power. Furthermore, if stakeholders decide to focus solely on the two main categories, we recommend testing the entire dataset using the CatBoost model to determine the best possible outcome.
By incorporating our recommendations and continually refining the chosen model, stakeholders can harness the power of machine learning to improve their decision-making processes and optimize their project strategies.