Cosmetic Product Development (ML)
The growing popularity of natural ingredient-based cosmetics, driven by consumer awareness of health and environmental benefits, has propelled a leading Toronto manufacturer to success in creating products for various brands and launching its own natural ingredient-focused line. This project aims to develop a data-driven model that recommends suitable natural ingredients for new cosmetic products based on customer ratings and reviews from Amazon. By utilizing the vast user-generated data on Amazon, the model will help the sponsor company understand consumer preferences, innovate highly desired products, and ultimately boost sales and customer satisfaction.
Dataset
My cosmetic product dataset is a comprehensive collection of information gathered through web scraping from Amazon, one of the largest online marketplaces. The original dataset contains 9,982 records and 97 columns, providing an extensive range of data points for each product.
The key features of this dataset include:
-
Product Title: The name of the cosmetic product as it appears on Amazon.
-
Product Description: A detailed description of the cosmetic product, including its key features, benefits, and ingredients.
-
Price: The current price of the cosmetic product on Amazon at the time the data was collected.
-
Number of Reviews: The total number of customer reviews for the cosmetic product on Amazon, which provides an indication of the product’s popularity and user feedback.
-
Rating: The average customer rating for the cosmetic product on a scale of 1 to 5, with 5 being the highest rating. This represents the overall satisfaction of customers who have purchased and used the product.
-
Seller Name: The name of the seller or vendor offering the cosmetic product on Amazon.
-
Product Brand: The brand name of the cosmetic product, which can be useful for understanding market trends and consumer preferences.
-
Product Category: The specific category under which the cosmetic product is listed on Amazon. This information can be used to group products and analyze trends within specific cosmetic categories.
Data Preparation
In the data preparation stage, I perform several essential steps to ensure that our cosmetic product dataset is clean, well-structured, and ready for analysis. This process involves labeling columns for better understanding, extracting features from the product descriptions, and creating target variables based on specific criteria.
-
Column Labeling: To make the dataset more comprehensible, I label each column with a clear and descriptive name. This helps users easily understand the contents and purpose of each column, simplifying the data exploration process.
-
Feature Extraction: One of the crucial aspects of our dataset is the product descriptions, as they contain valuable information about the ingredients used in each cosmetic product. To make this information more accessible, we extract the ingredients from the description column and transform them into separate columns using a one-hot encoding approach. This enables users to easily analyze the presence and importance of specific ingredients across different products.
-
Outlier Detection and Handling: I determine outliers by visualizing the data distribution using boxplots. Since most of the data is skewed, we choose to replace outliers with the median rather than the mean. The median is less sensitive to extreme values, making it a more robust measure for skewed data. This step helps to minimize the impact of outliers on our analyses and models.
-
Target Variable Creation: In order to identify and classify high-quality cosmetic products, we establish a set of criteria based on the number of reviews and the average rating. A product is considered “good” if it has more than 400 reviews and an average rating of more than 4. Using these criteria, we create a binary target variable for each product in the dataset, where 1 represents a “good” product and 0 represents a product that does not meet the criteria.
Exploratory Data Analysis
In the Exploratory Data Analysis (EDA) phase, we delve deeper into the dataset to uncover trends and patterns. Our investigation reveals the most frequently occurring ingredients, as well as the distribution of brands and the top-performing brands according to our criteria.
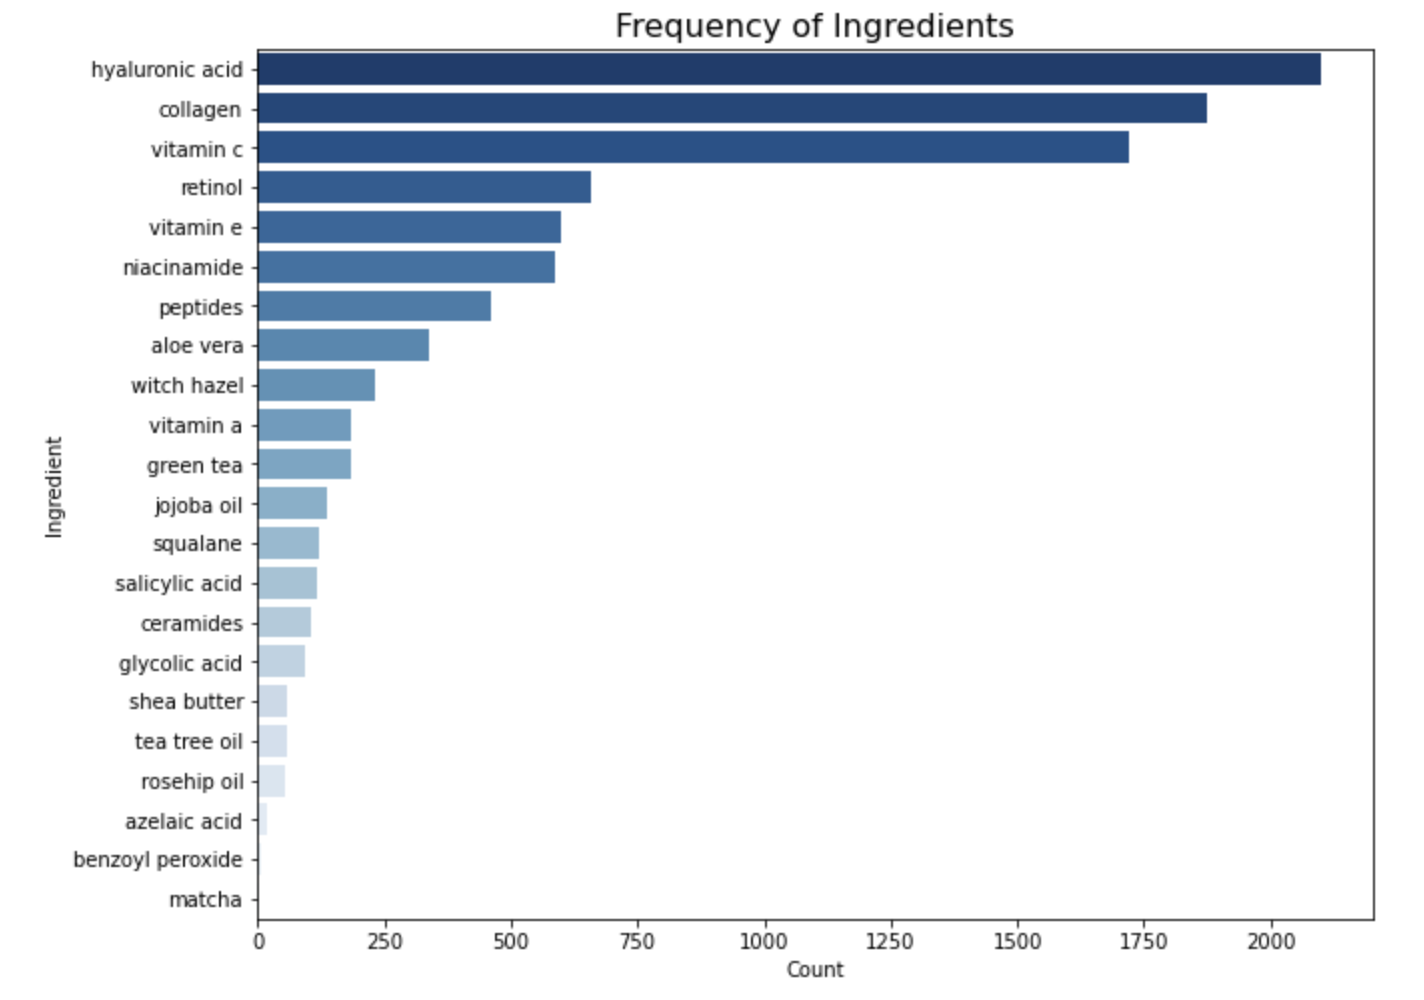
Ingredient Frequency: Our analysis highlights the most common ingredients found in the cosmetic products. Hyaluronic acid emerges as the top ingredient, followed by collagen, vitamin C, and retinol. These ingredients are known for their beneficial properties and are widely used in the cosmetics industry.
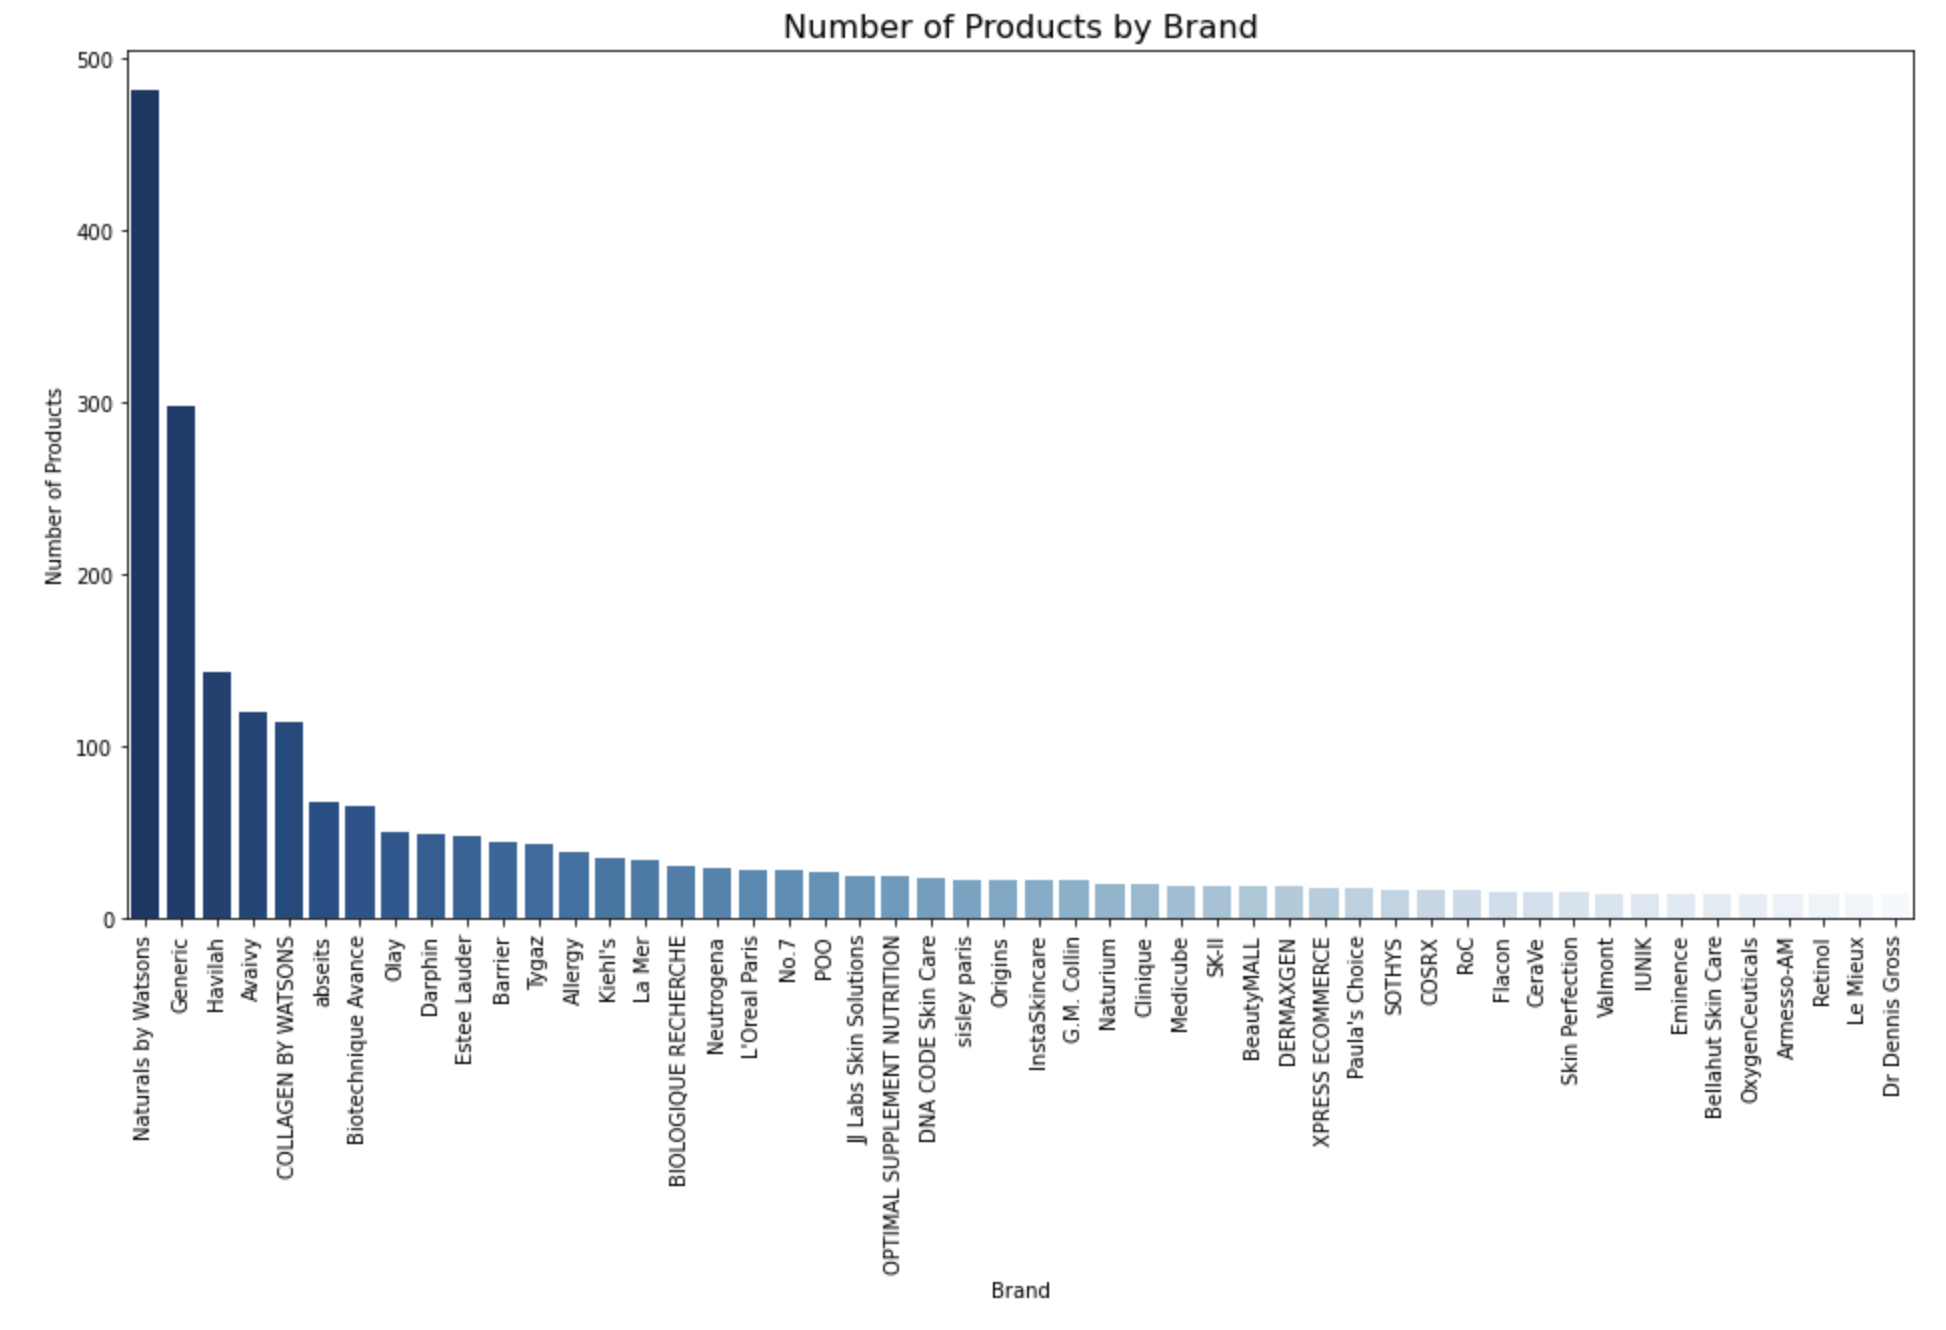
Brand Distribution: We examine the brand distribution within the dataset and find that Naturals by Watsons, Generic, and Havilah are the most frequently occurring brands. This information helps us understand the market presence of various brands in the dataset.
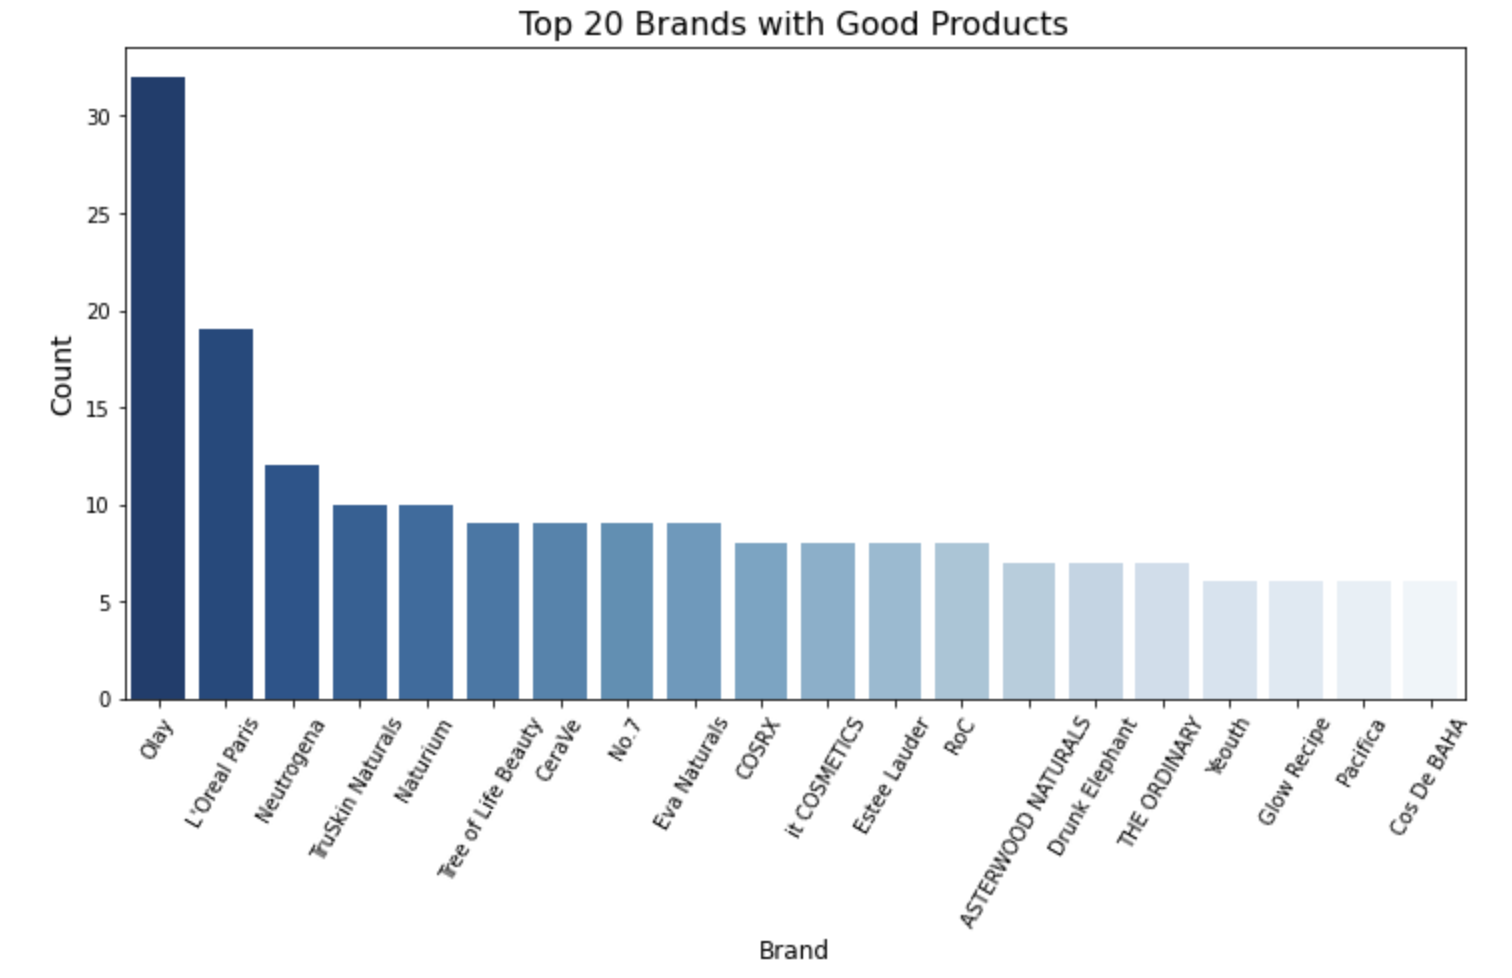
Top-Performing Brands: By applying our “good product” criteria, we identify the top-performing brands with the highest number of high-quality products. Olay, L’Oréal, and Neutrogena stand out as the top brands in this category, showcasing their commitment to customer satisfaction and product effectiveness.
Decision Tree Model
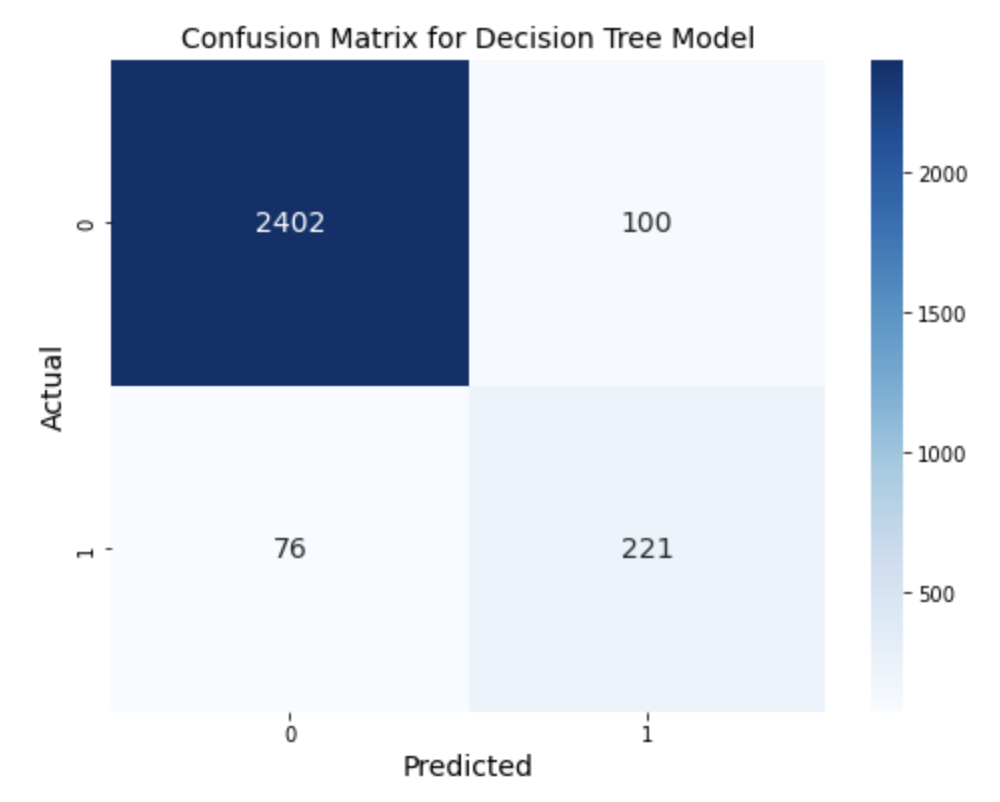
In this particular case, it’s crucial to focus on minimizing false positives, as they can lead to the company investing significant resources in developing products that do not meet the “good product” criteria. Misclassifying a product as good when it’s not can result in wasted resources and diminished customer satisfaction.
To optimize the model for this specific scenario, we should concentrate on improving recall or precision. Recall represents the proportion of actual positive cases correctly identified, while precision measures the proportion of true positive cases among the predicted positives. Balancing these two metrics ensures that the model performs well in identifying good products while minimizing false positives.
However, for this Decision Tree model, the precision we obtained is only 69%, which suggests that there is room for improvement. Therefore, we consider exploring different models to compare their results and identify a more suitable model that can deliver higher precision, better aligning with our business objectives and reducing the risk of investing in the wrong products.
Random Forest Model
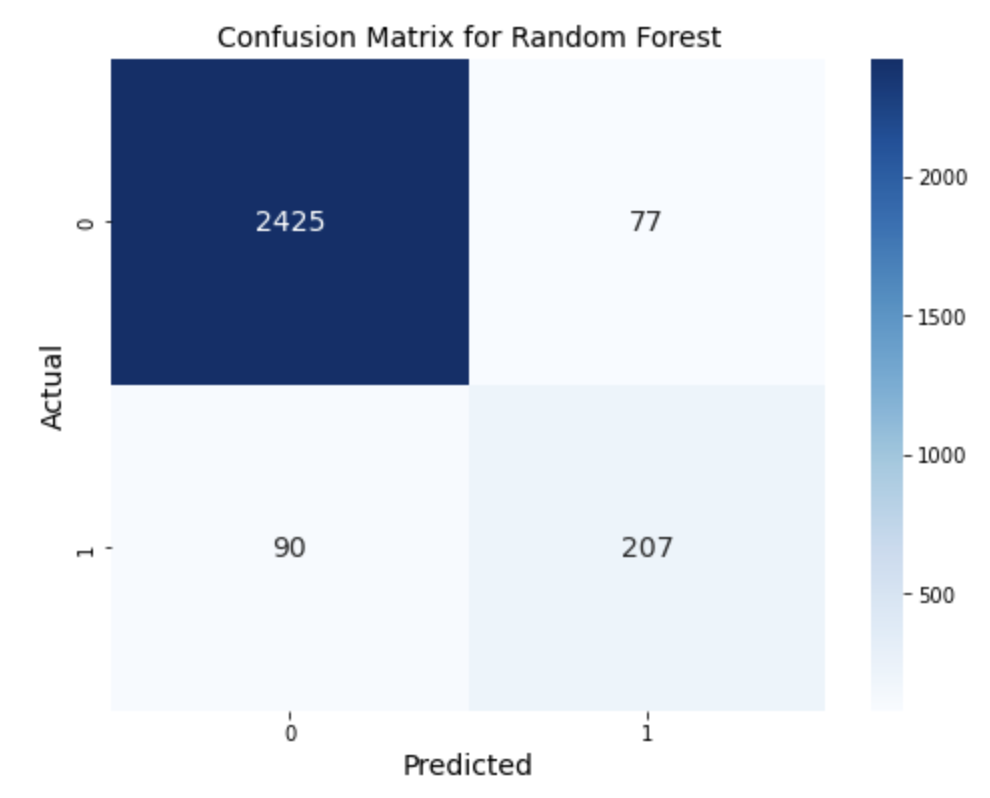
Next, we employed the Random Forest model, utilizing 100 trees, to compare its performance with the Decision Tree model. The results showed an increase in precision to 73%, which is a notable improvement, while maintaining the overall accuracy at 94%. This demonstrates the effectiveness of the Random Forest model in enhancing the classification of our primary objective.
Although the Random Forest model yields better precision than the Decision Tree model, it may still not be the optimal choice for informing business decisions. To ensure the best possible recommendations for the company, it is essential to explore alternative models or techniques to further improve precision, ultimately leading to a more reliable and robust solution for the classification task.
XGboost Model
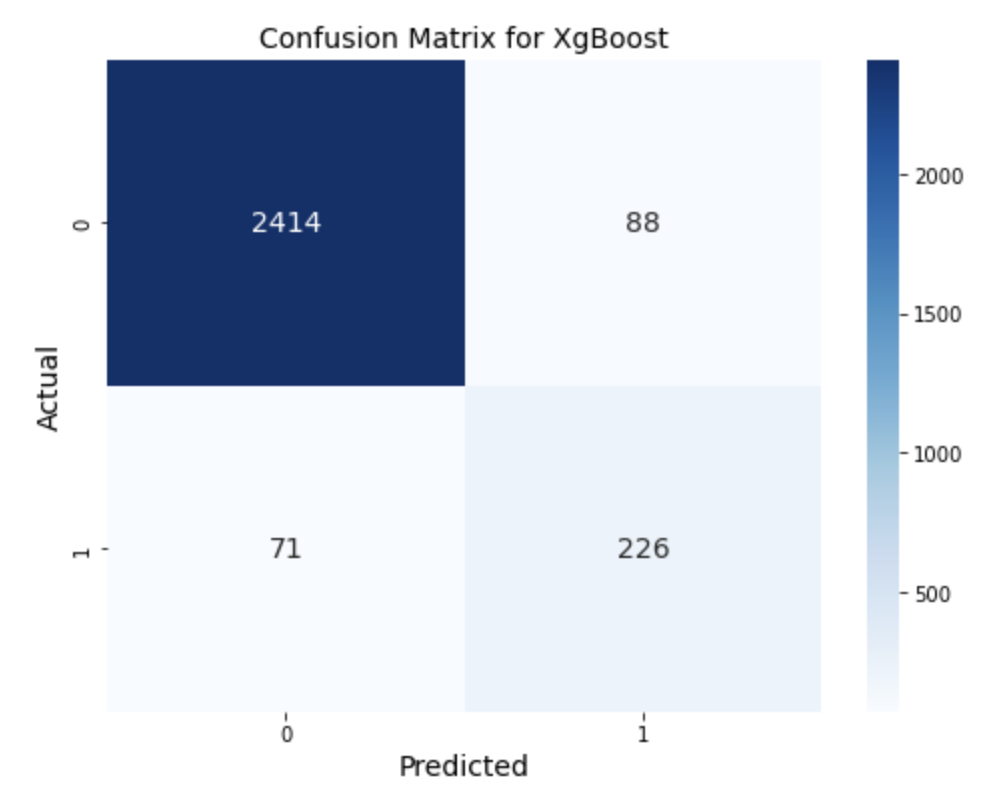
We then applied the XGBoost model to compare its performance with the previous models. The results show that the accuracy remained consistent at 94%, and the precision was slightly lower at 72%. However, the recall increased from 70% in the Random Forest model to 76% in the XGBoost model. Based on these metrics, XGBoost is considered the best model for our classification task among the models tested.
Next Step
For future analysis, we aim to enhance our model’s performance and accuracy through various approaches, making it even more valuable and reliable for business decision-making.
-
Hyperparameter Tuning: We plan to fine-tune the XGBoost model by performing hyperparameter tuning using techniques such as grid search or random search. This process will help us identify the most suitable combination of parameters for prediction, potentially leading to better classification performance.
-
Feature Engineering: To further reduce the false positive rate and improve the model’s performance, we intend to incorporate more features, such as the country of the brand, the quantity of ingredients, and product packaging types. We will also explore techniques like feature selection, feature extraction, and feature transformation to optimize the dataset for our model.
-
Advanced Machine Learning Techniques: We plan to explore advanced machine learning techniques, such as deep learning, which can potentially uncover more complex patterns and relationships within the data. By employing deep learning algorithms, such as convolutional neural networks (CNNs), recurrent neural networks (RNNs), or transformers, we may be able to achieve even better classification results.
-
Ensemble Methods: Another approach to improve the model’s performance is to use ensemble methods, combining multiple models to make predictions. Techniques such as stacking, bagging, and boosting can help reduce overfitting and increase the overall performance of our classifier.