Benefit-Cost Analysis of Dam Construction Projects (Excel: Monte Carlo Simulation & Chi-Squared Test))
Introduction
The purpose of this analysis is to apply benefit-cost analysis to two construction projects, Dam 1 in Southwest Georgia and Dam 2 in North Carolina, in order to support the corporation in determining which project provides the greatest benefit. By analyzing six benefit categories (improved navigation, hydroelectric power, fish and wildlife, recreation, flood control, and commercial development of the area), as well as two cost areas (Annualized capital cost and operations and maintenance). A project that generates a greater benefit-cost ratio than 1 indicates that the project generates more benefits than it costs.
Part 1
First, I performed the Monte Carlo simulation by generating 10,000 random observations to compare the benefit-cost ratio between two construction projects.
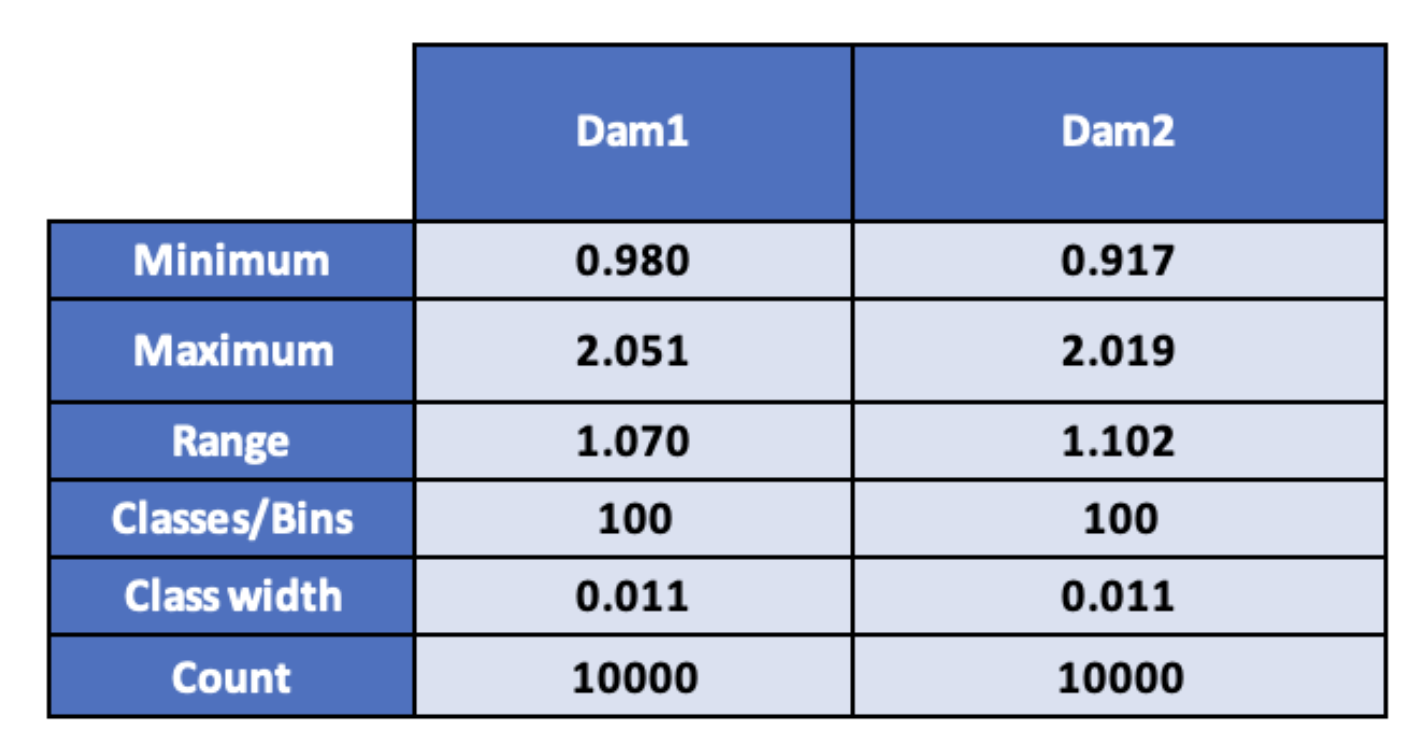
According to the calculation, Dam 1 appears to have a more significant number of benefit-cost ratios at both the minimum and maximum levels than Dam 2. On the other hand, Dam 2 is likely to have a bigger range than Dam 1. Therefore, the data we have now is not significant enough to confirm which projects are performing better. Hence, I conducted the frequency distribution to determine the pattern of our data and analyze the values that data is likely to fall into.
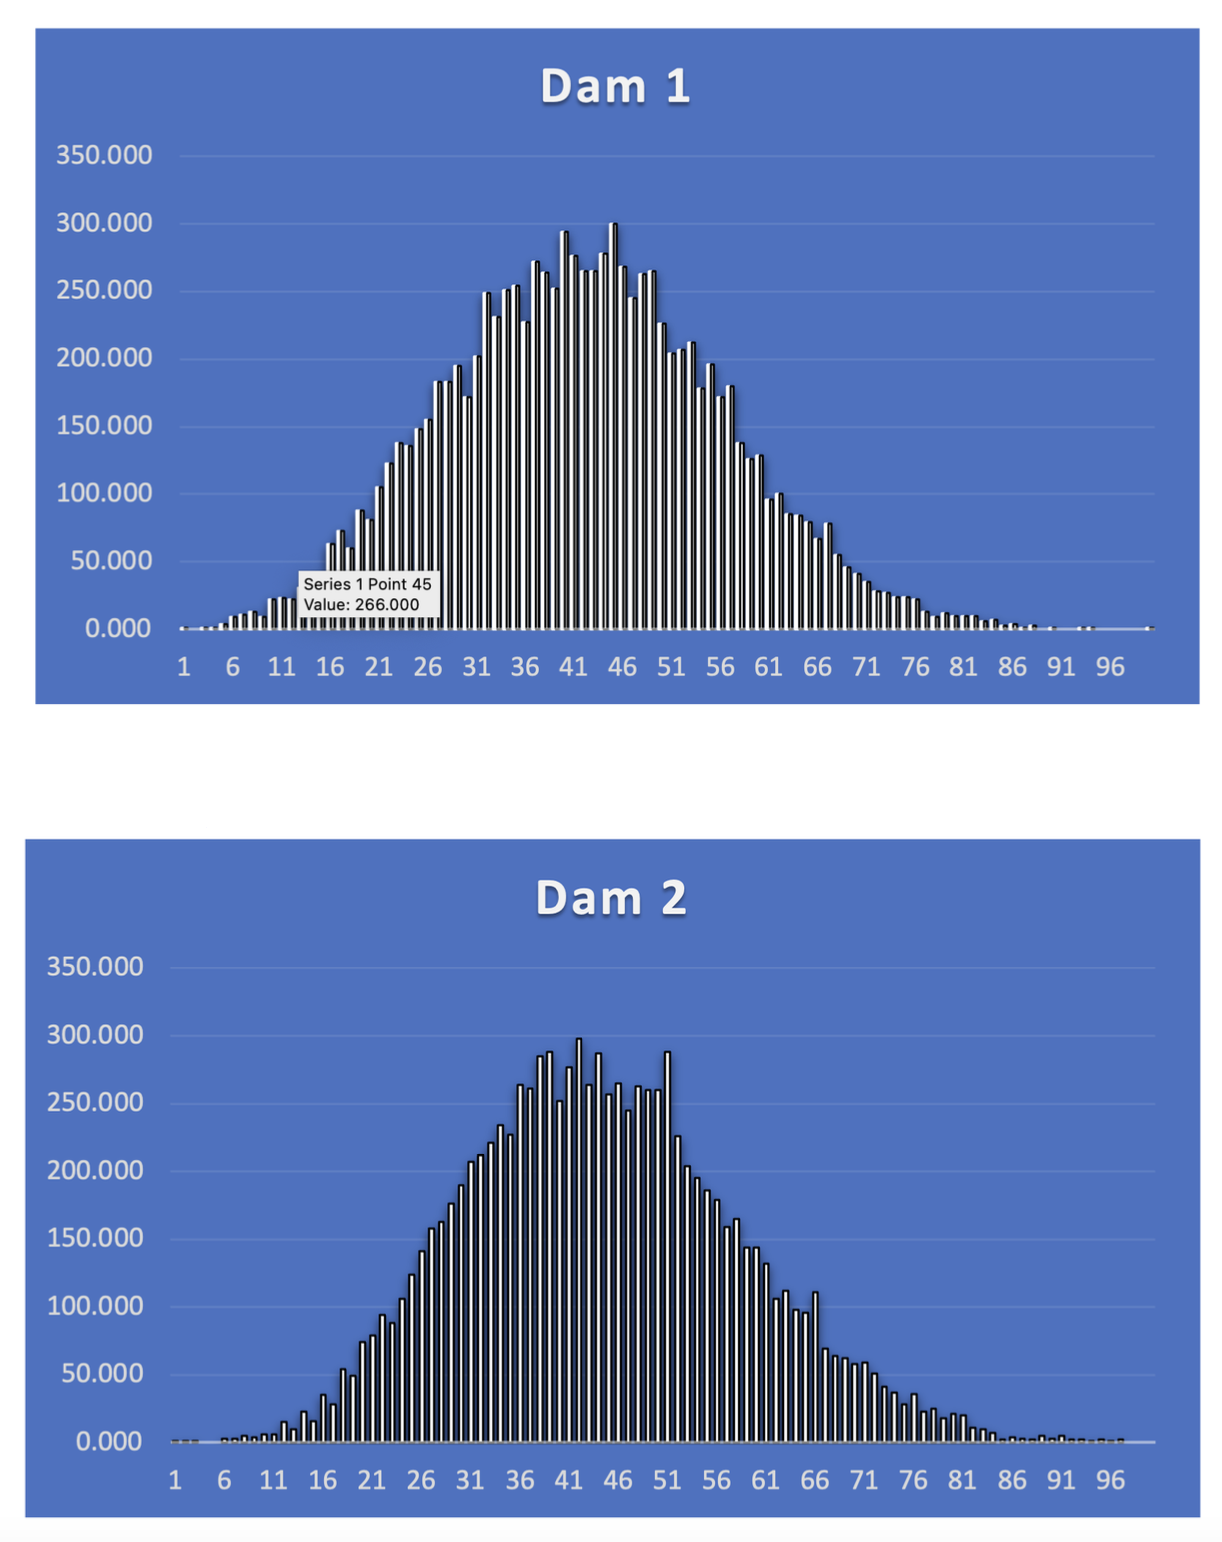
The frequency distribution from both projects in Figure 2 and Figure 3 indicates that the data was normally distributed. Both charts almost have the same peak and slightly to the left side indicate that they were right-skewed.
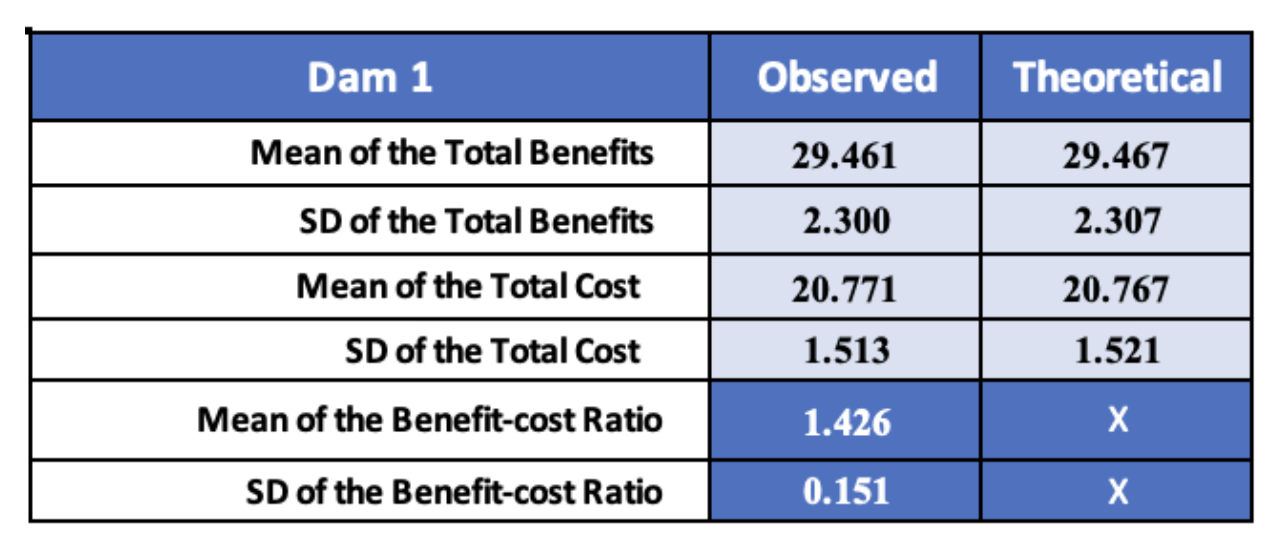
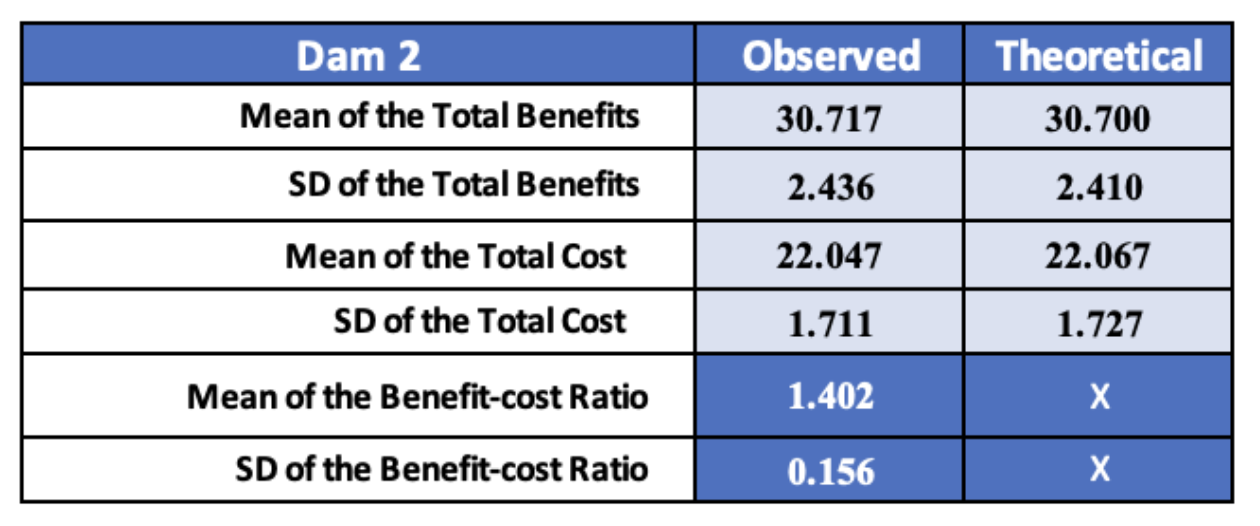
After that, I calculated the mean of total benefits and cost in both two projects and examined the values we retrieved from experimental and observed studies. Figure 4 and Figure 5 reveal that the outcome is almost the same in both observed and theoretical values in Dam 1 and Dam 2. Dam 2 appears to provide a higher mean total benefit in both techniques than Dam 1. However, it appears that Dam 1 has a lower total cost than Dam 2. By calculating the mean of the benefit-cost ratio, we can see that Dam 1 slightly gave a better result than Dam 2.
Part 2
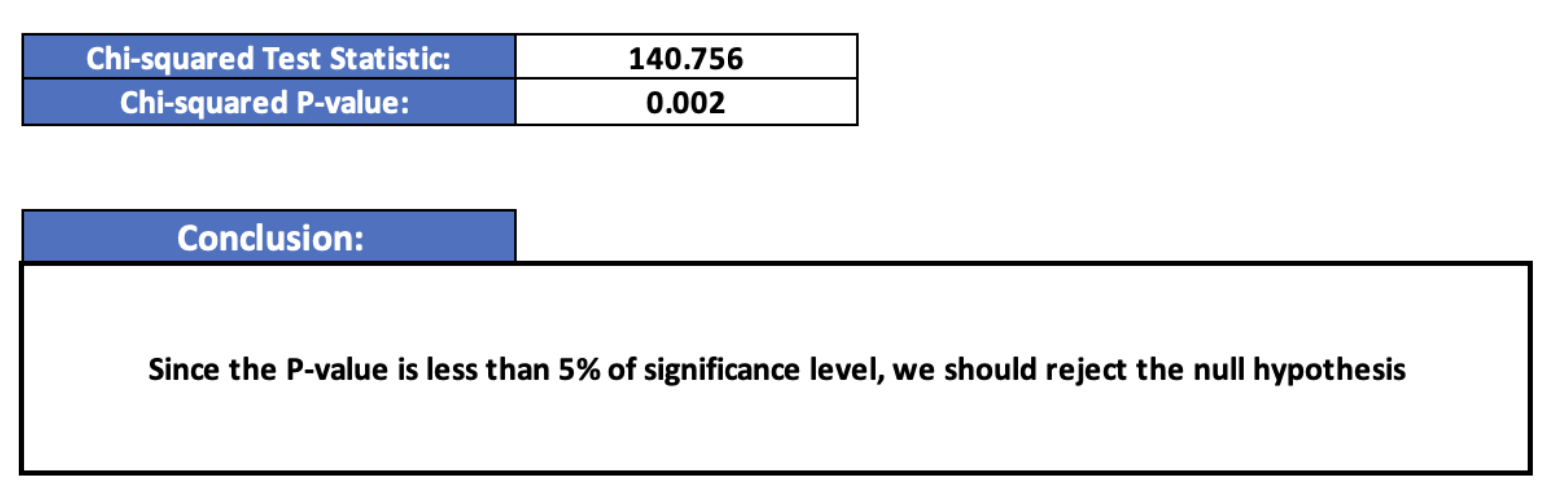
Next, I performed the Chi-Squared distribution to ensure that my selected distribution was a good fit for the distribution in Dam 1, which in this case, I used the normal distribution. To begin, we must make the following assumption: * Null hypothesis: Normal distribution is good fit for Dam 1 * Alternative hypothesis: Normal distribution is not a good fit for Dam 1 As illustrated in Figure 6, the P-value is less than 5% of the significance level after completing the Chi-Squared test, indicating that we should reject the null hypothesis. Similarly, there is sufficient evidence to reject the claim that the normal distribution fits Dam 1’s distribution.
Part 3
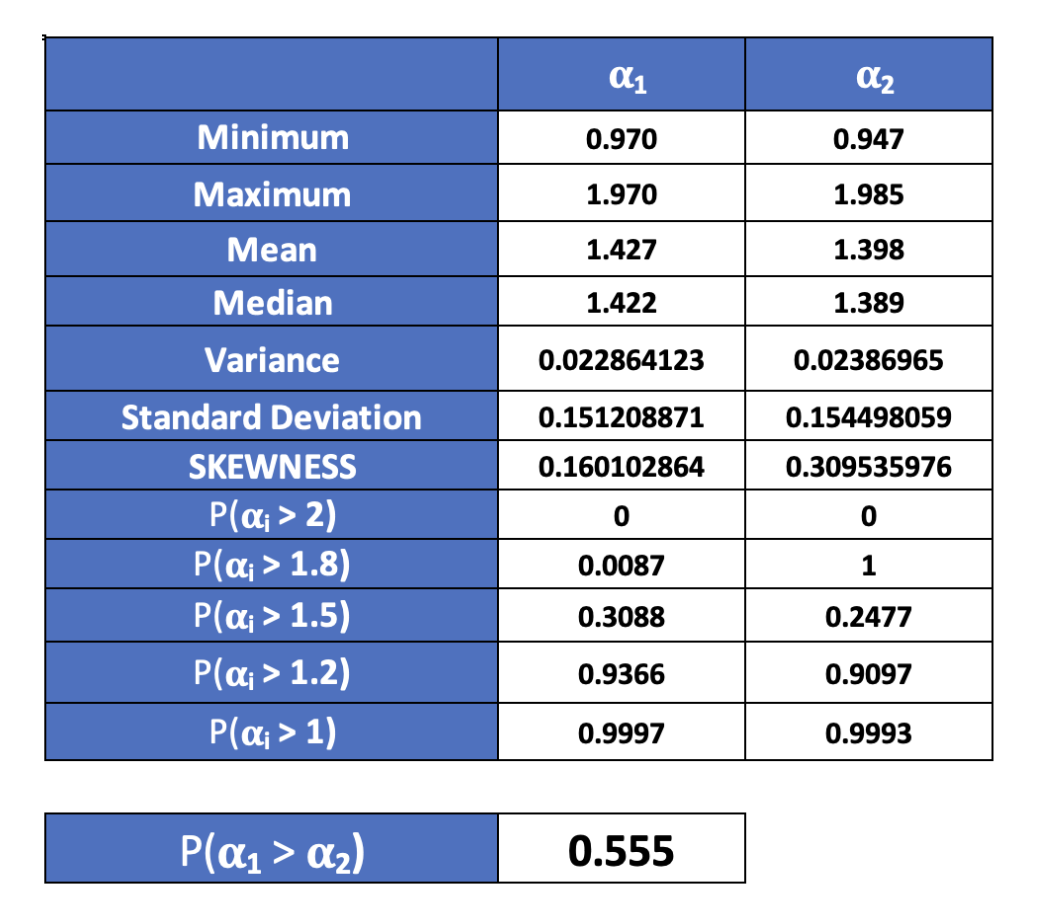
In the final step, I calculate the probability of Dam 1 and Dam 2 by using the data we acquire from the Monte Carlo simulation. We can see that the possibility that both projects will have 𝛂1 > 2 is none, and the average benefit-cost ratio of Dam 1 is approximately 1.427, which is a little bit higher than Dam 2, which is 1.398. Furthermore, there is a most likely chance that both 𝛂1 and 𝛂2 are higher than 1, 0.9997, and 0.9993, respectively, which is very high, indicating that two projects are most likely to generate benefits than the cost. However, suppose we need to choose only one project. In that case, we use the probability of 𝛂1 > 𝛂2 to determine the possibility of the benefit-cost ratio of which projects are likely to generate more benefit. As a result, we can see that P ( 𝛂1 > 𝛂2 ) is 0.555, representing that there is more than 50% that 𝛂1 will be outperformed 𝛂2.
Conclusion
In conclusion, based on the Monte Carlo and Chi-Squared distribution results, both experimental and observational studies concluded that the company should prioritize Dam 1 (the construction project in Southwest Georgia) over Dam 2 (the construction project in North Carolina), as the probability of benefit-cost ratio indicated a 55% chance that Dam 1 will generate more benefit than Dam 2.